
DDC-15: Two-samples t-test
A data challenge a day helps you master machine learning

About these daily data challenges
Each post is an exercise that helps you learn about data in Python.
Try to solve the exercise before checking my solution at the bottom of the post 🤓
You can share your solution or visualization in the comments!
Today’s challenge
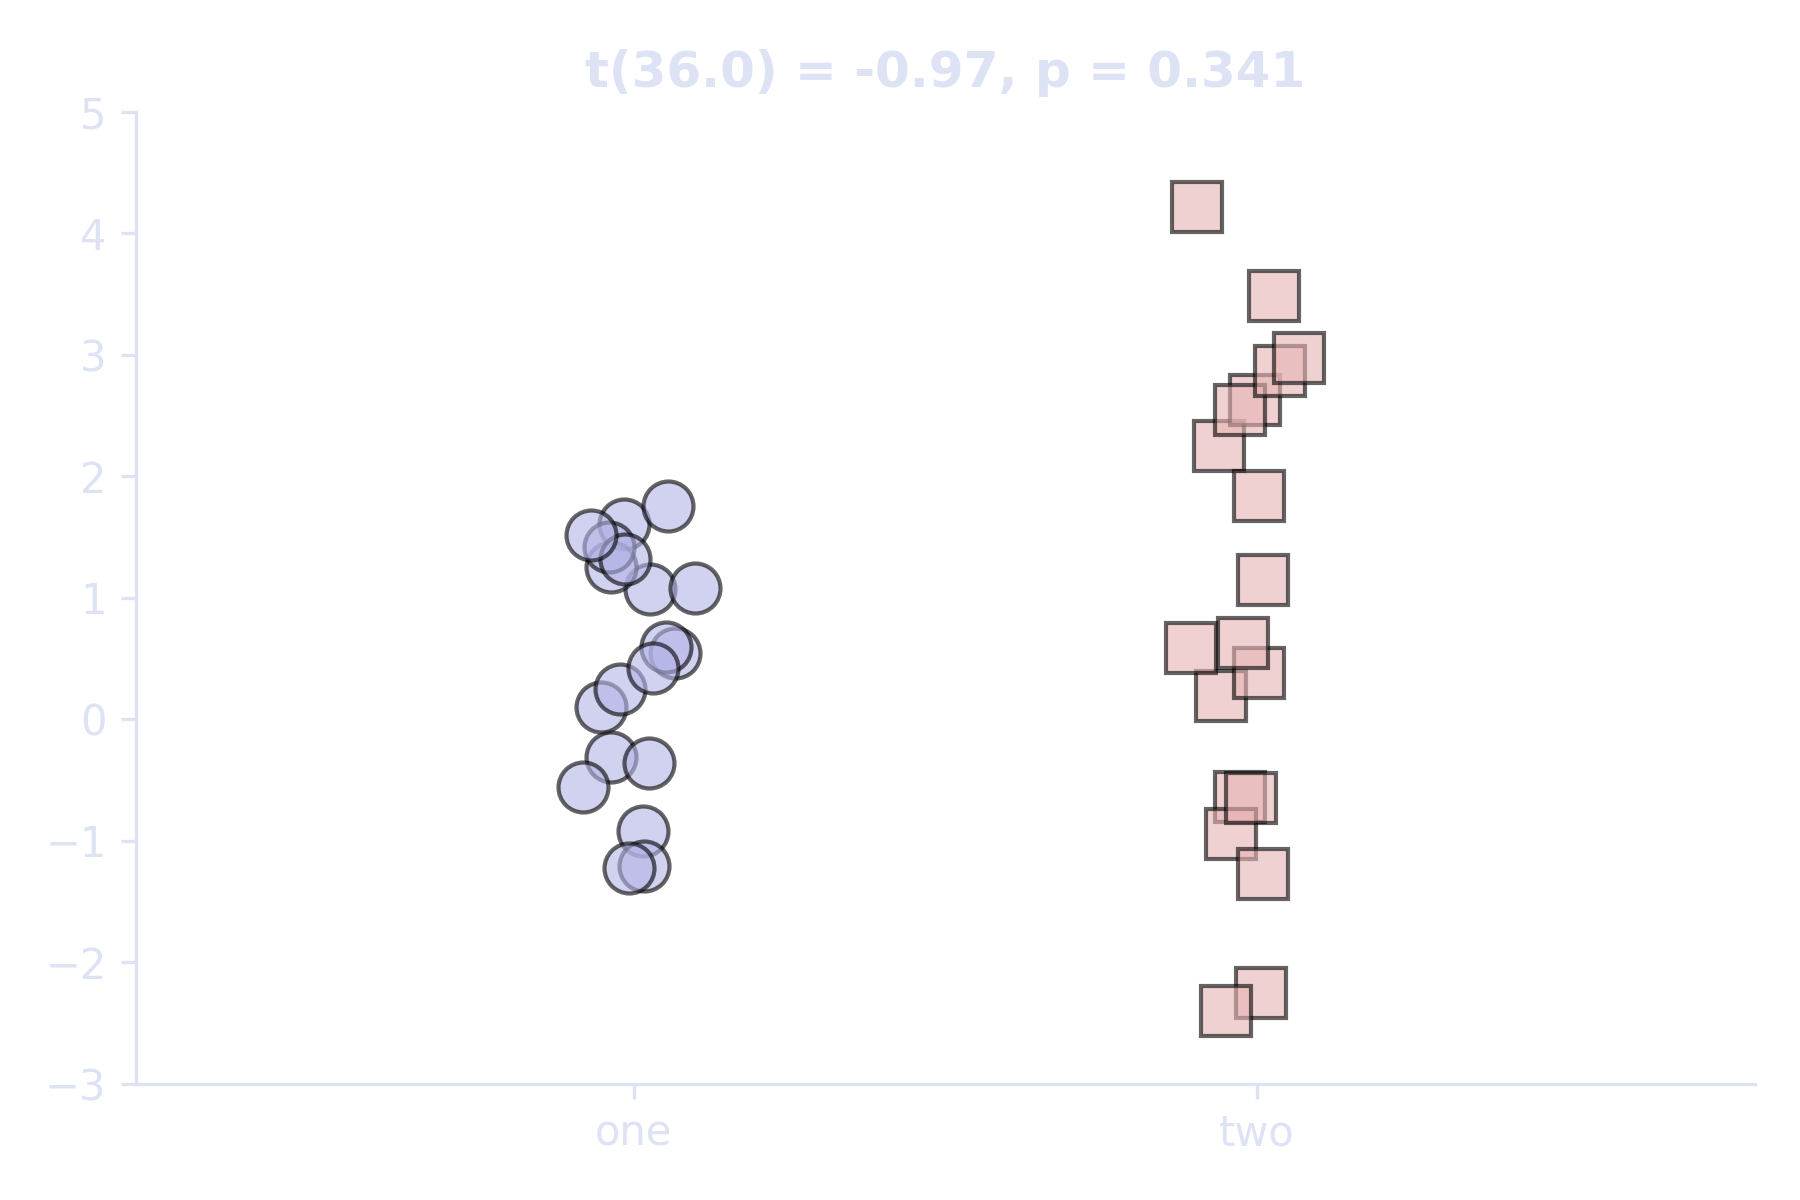
Compare two samples of data using an independent-samples t-test. Both datasets are random numbers drawn from normal distributions, both with a sample size of 19. Dataset “1” is drawn from a distribution with a mean of 0 and standard deviation of 1; dataset “2” is from a distribution with a mean of 1 and standard deviation of 2.
Use numpy’s random.default_rng method with the seed = 135246. That will reproduce the figure below exactly. The x-axis jitters are normally distributed numbers with a mean of 1 or 2 (according to the x-axis ticks) and a standard deviation of .05. White horizontal bars show the mean of each group.
.
.
.
.
Scroll down for the solution…
.
.
.
.

.
.
.
.
keep scrolling!
.
.
.
.
import numpy as np
import scipy.stats as stats
import matplotlib.pyplot as plt

# random seed
seed = 135246
rng = np.random.default_rng(seed)

# data
samplesize = 19
data1 = rng.normal(0,1,size=samplesize)
data2 = rng.normal(1,2,size=samplesize)

# t-test
tstat = stats.ttest_ind(data1,data2)

# plot data
plt.figure(figsize=(6,4))
plt.plot(rng.normal(1,.05,samplesize),data1,'ko',markerfacecolor=[.7,.7,.9,.6],markersize=12)
plt.plot(rng.normal(2,.05,samplesize),data2,'ks',markerfacecolor=[.9,.7,.7,.6],markersize=12)

# plot means
plt.plot([.8,1.2],np.ones(2)*data1.mean(),'w',zorder=-5)
plt.plot([1.8,2.2],np.ones(2)*data2.mean(),'w',zorder=-5)

# finalize
plt.gca().set(xlim=[.2,2.8],ylim=[-3,5],xticks=[1,2],xticklabels=['one','two'],
              title=f't({tstat.df}) = {tstat.statistic:.2f}, p = {tstat.pvalue:.3f}')

plt.show()