
DDC-17: Correlation significance with scipy
A data challenge a day helps you master machine learning

About these daily data challenges
Each post is an exercise that helps you learn about data in Python.
Try to solve the exercise before checking my solution at the bottom of the post 🤓
You can share your solution or visualization in the comments!
Today’s challenge
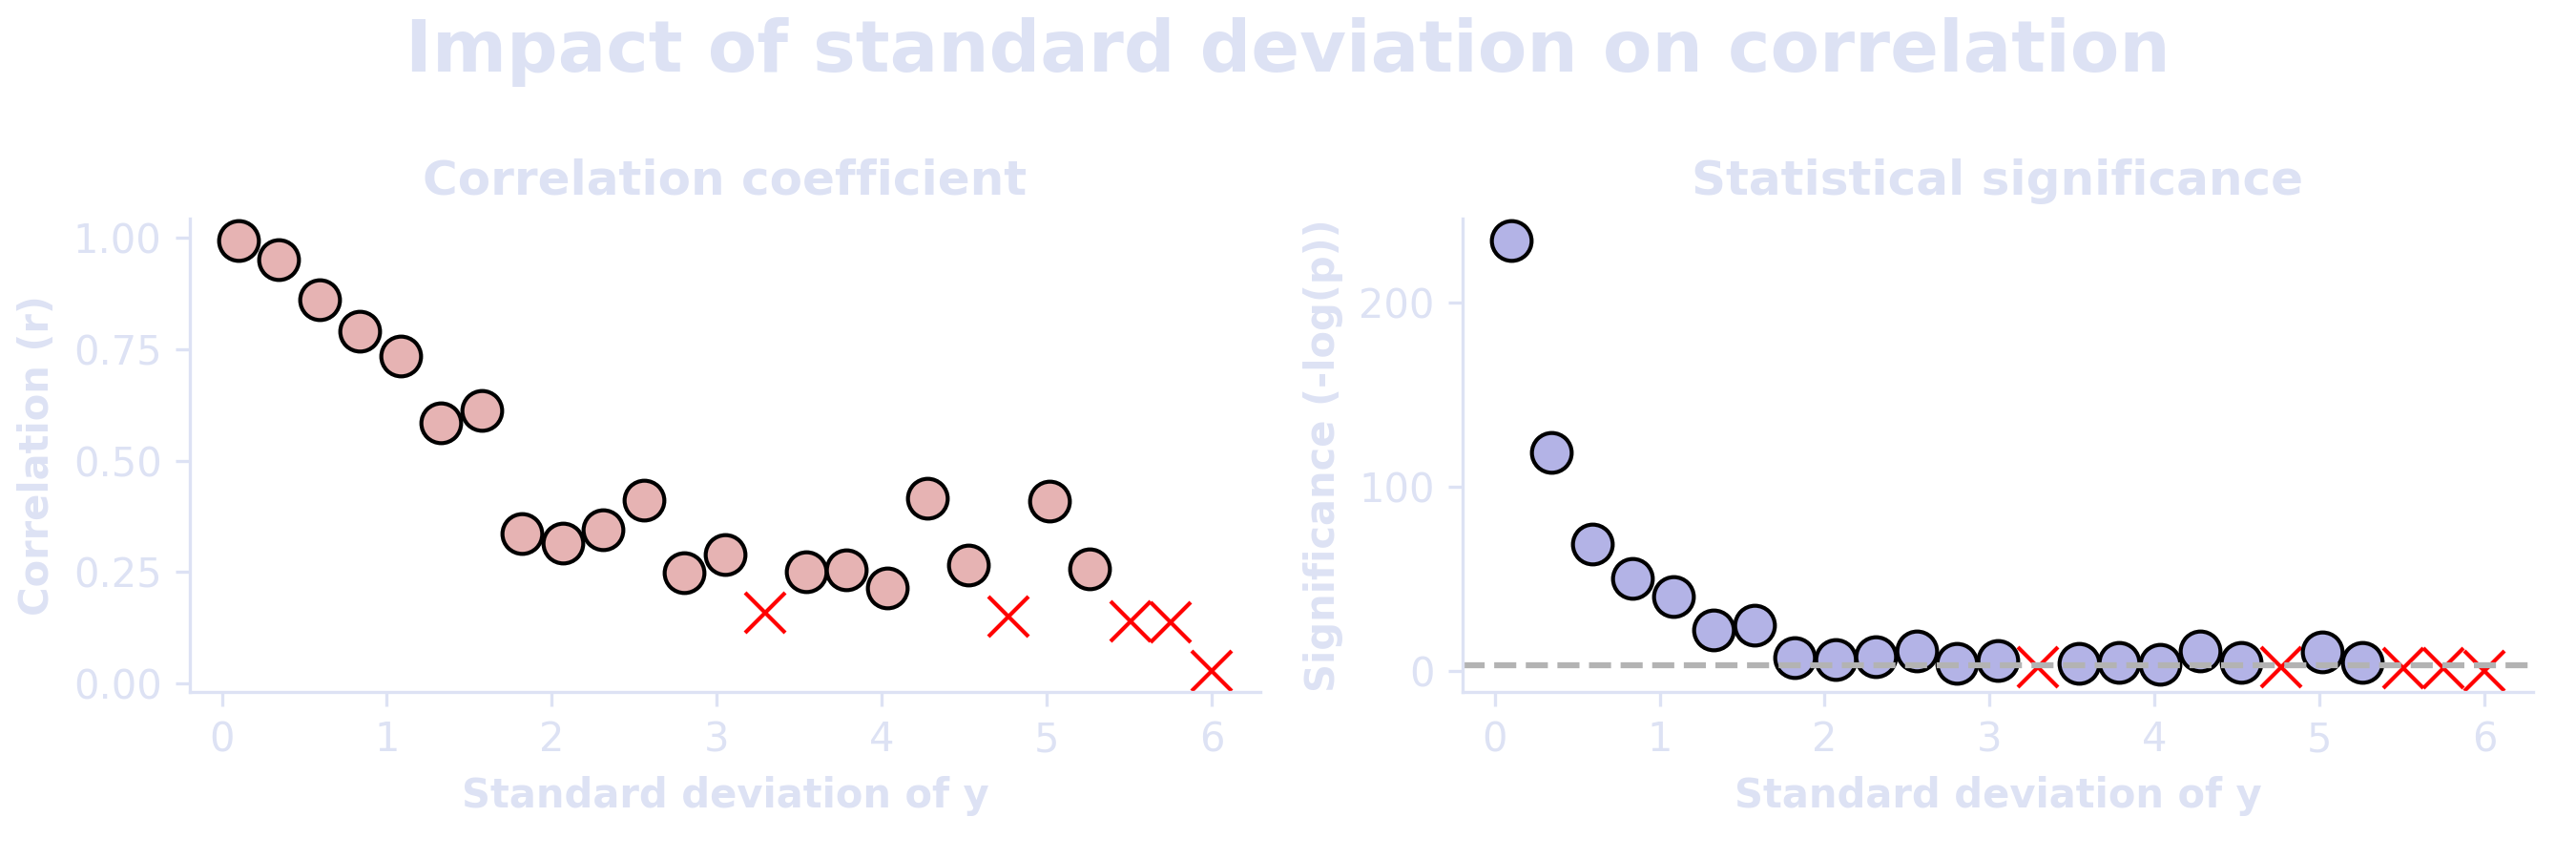
The goal of this exercise is to run a simulation to explore the impact of standard deviation on the correlation coefficient and its significance. Use scipy.stats.pearsonr, because the numpy corrcoef function does not calculate p-values (statistical significance probabilities).
At each of 25 iterations in a for-loop, create variable x as 100 normally distributed random numbers with a mean of 0 and standard deviation of 1. And create variable y as x plus random numbers with a mean of 0 and a standard deviation that ranges from .1 to 6 over the 25 loop iterations. In the plots below, the correlation coefficient and p-value are replaced with a red “x” if the p-value is non-significant (p>.05). The p-values are visualized as -log(p), and the horizontal line corresponds to the statistical significance threshold (-log(.05)).
.
.
.
.
Scroll down for the solution…
.
.
.
.

.
.
.
.
keep scrolling!
.
.
.
.
import scipy.stats as stats
import numpy as np
import matplotlib.pyplot as plt

# setup the simulation parameters
N = 100
stds = np.linspace(.1,6,25)

# setup the figure
_,axs = plt.subplots(1,2,figsize=(9,3))

# run the simulations
for std in stds:

  # generate the data
  x = np.random.normal(0,1,N)
  y = x + np.random.normal(0,std,N)

  # calculate the correlation
  r,p = stats.pearsonr(x,y) # outputs are (coefficient,p-value)

  # set the marker according to statistical significance
  if p>.05:
    marker = 'rx'
  else:
    marker = 'ko'

  # visualize
  axs[0].plot(std,r,marker,markerfacecolor=[.9,.7,.7],markersize=10)
  axs[1].plot(std,-np.log(p),marker,markerfacecolor=[.7,.7,.9],markersize=10)


axs[1].axhline(y=-np.log(.05),color=[.7,.7,.7],linestyle='--')
axs[0].set(xlabel='Standard deviation of y',ylabel='Correlation (r)',
           title='Correlation coefficient')
axs[1].set(xlabel='Standard deviation of y',ylabel='Significance (-log(p))',
           title='Statistical significance')
plt.suptitle('Impact of standard deviation on correlation',fontweight='bold',fontsize=18)

plt.tight_layout()
plt.show()
Thank you Mike, pretty challenging but also educational!!