
DDC-37: KNN classification
A data challenge a day helps you master machine learning
About these daily data challenges
Each post is an exercise that helps you learn about data in Python.
Try to solve the exercise before checking my solution at the bottom of the post 🤓
You can share your solution or visualization in the comments!
Today’s challenge
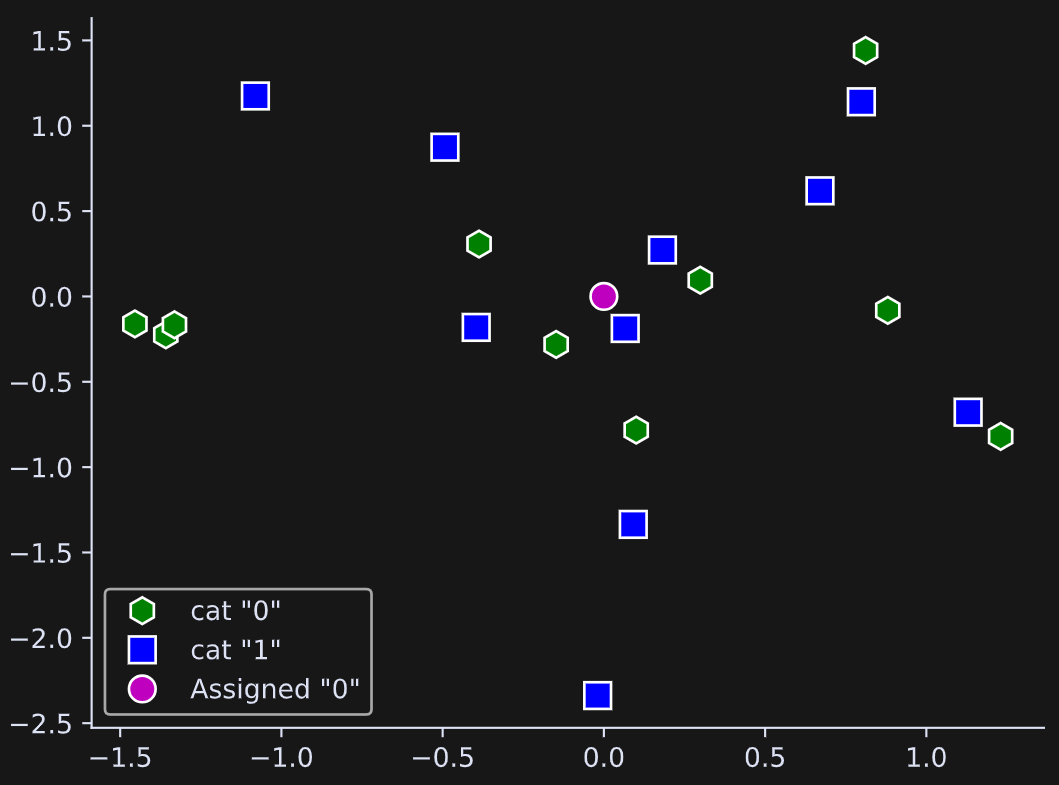
Create a dataset of 20x2 random numbers, with the first 10 in “group 0” and the next 10 in “group 1.” Use the k-nearest-neighbors classification algorithm to determine whether the point at the origin (0,0) belongs to group “0” or “1”.
The knn classifier is in the sklearn.neighbors library. Use k=3. Show the data in a figure like this:
.
.
.
.
Scroll down for the solution…
.
.
.
.

.
.
.
.
keep scrolling!
.
.
.
.
import numpy as np
import matplotlib.pyplot as plt
from sklearn.neighbors import KNeighborsClassifier

# generate and plot data
N = 20
data = np.random.randn(N,2)
labels = (np.arange(N)>(N-1)//2).astype(int)
newpoint = np.array([0,0])

plt.plot(data[labels==0,0],data[labels==0,1],'hw',markerfacecolor='g',markersize=10,label='cat "0"')
plt.plot(data[labels==1,0],data[labels==1,1],'sw',markerfacecolor='b',markersize=10,label='cat "1"')

# knn analysis
k = 3
knn = KNeighborsClassifier(n_neighbors=k, metric='euclidean')
knn.fit(data,labels)
predicted = knn.predict(newpoint.reshape(1,-1))[0]

# plot the new point with label
plt.plot(newpoint[0],newpoint[1],'wo',markerfacecolor='m',markersize=10,label=f'Assigned "{predicted}"')

plt.legend()
plt.show()
Thank you!
Hii,
Please see below:
# DDC-37: KNN classification
import numpy as np
from sklearn.neighbors import KNeighborsClassifier
import matplotlib.pyplot as plt
# ---creating the random numbers groups---
Group0 = np.random.uniform(-2.5, 1.5, size = (10,2))
Group1 = np.random.uniform(-2.5, 1.5, size = (10,2))
# ---combine into one dataframe---
X = np.vstack ((Group0, Group1))
# ---Label---
y = np.array ([0]*len(Group0)+ [1]* len(Group1))
# --- create the knn model---
knn = KNeighborsClassifier (n_neighbors=3)
# ---fit the model---
knn.fit (X, y)
# ---predict for p (0,0)---
new_point = np.array ([[0,0]])
new_prediction = knn.predict(new_point)
print ( "Prediction for new point:", new_prediction)
# ---Plot---
X_0 = X [y==0]
X_1 = X [y==1]
plt.scatter (X_0[:,0], X_0[:, 1] , color = "blue", s = 70, marker = "^" , label = "Group 0")
plt.scatter (X_1[:,0], X_1[:, 1] , color = "red", s = 70, marker="o", label = "Group 1")
plt.scatter (new_point[0,0], new_point[0,1], color = "Green", marker="X", s=100, label= "new point")
plt.xlabel ("Feature 1")
plt.ylabel ("Feature 2")
plt.legend()
plt.show()