
About these daily data challenges
Each post is an exercise that helps you learn about data in Python.
Try to solve the exercise before checking my solution at the bottom of the post 🤓
You can share your solution or visualization in the comments!
Today’s challenge
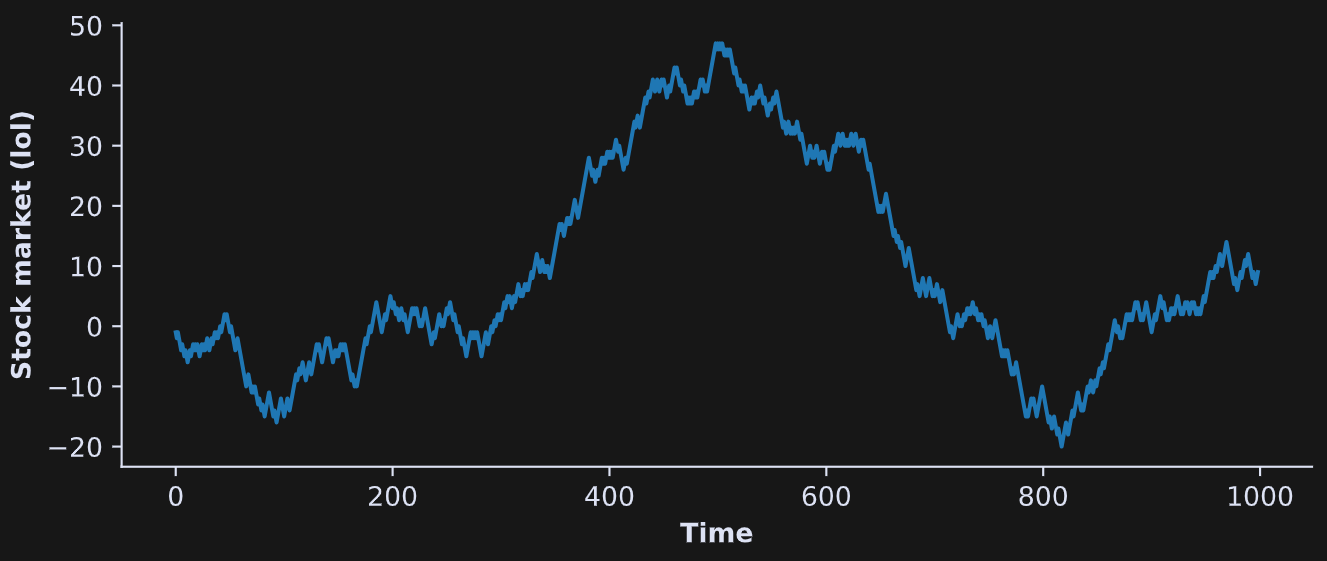
Create a time series of 999 points, where each point is the previous point plus the number -1 or +1 (randomly selected). This is called a “random walk” or Brownian motion.
Solve this challenge twice: First using a for-loop, and second using vectorization (no loops).
Plot the result as a line as in the figure below.
.
.
.
.
Scroll down for the solution…
.
.
.
.

.
.
.
.
keep scrolling!
.
.
.
.
import numpy as np
import matplotlib.pyplot as plt

N = 999

# with for-loop
rw = np.zeros(N)
for i in range(1,N):
  rw[i] = rw[i-1] + np.random.choice([-1,1])

# vectorized
rw = np.cumsum( np.random.choice([-1,1],N) )

plt.figure(figsize=(8,3))
plt.plot(rw)
plt.gca().set(xlabel='Time',ylabel='Stock market (lol)')
plt.show()
Thanks!
Here's my solution:
# DDC-38: Random walk
import matplotlib.pyplot as plt
import numpy as np
import random
import pandas as pd
# ---method A - using a for loop---
time_series_length = 1000
brownian_motion = [0]
# ---generating the data using a for loop---
for i in range (1, time_series_length):
direction = 2*np.random.randint(0,2)-1
brownian_motion.append (brownian_motion[i-1]+ direction)
# ---convert to a pandas series---
time_series = pd.Series (brownian_motion)
# ---plot---
plt.figure(figsize= (12,8))
plt.plot (time_series)
plt.xlabel ("time")
plt.ylabel("stock market")
# ---Method B - using vectorization---
# ---Generate random steps using vectorization---
steps = np.random.choice ([-1, 1], size = time_series_length-1)
# --- calculate the comulative sum---
brownian_motion_vec = np.insert(np.cumsum(steps), 0, 0)
# ---convert to a pandas series---
time_series_vec = pd.Series(brownian_motion_vec)
# --- plot---
plt.figure(figsize= (10,4))
plt.plot (time_series_vec)
plt.xlabel ("time")
plt.ylabel("stock market")