

About these daily data challenges
Each post is an exercise that helps you learn about data in Python.
Try to solve the exercise before checking my solution at the bottom of the post 🤓
You can share your solution or visualization in the comments!
Today’s challenge
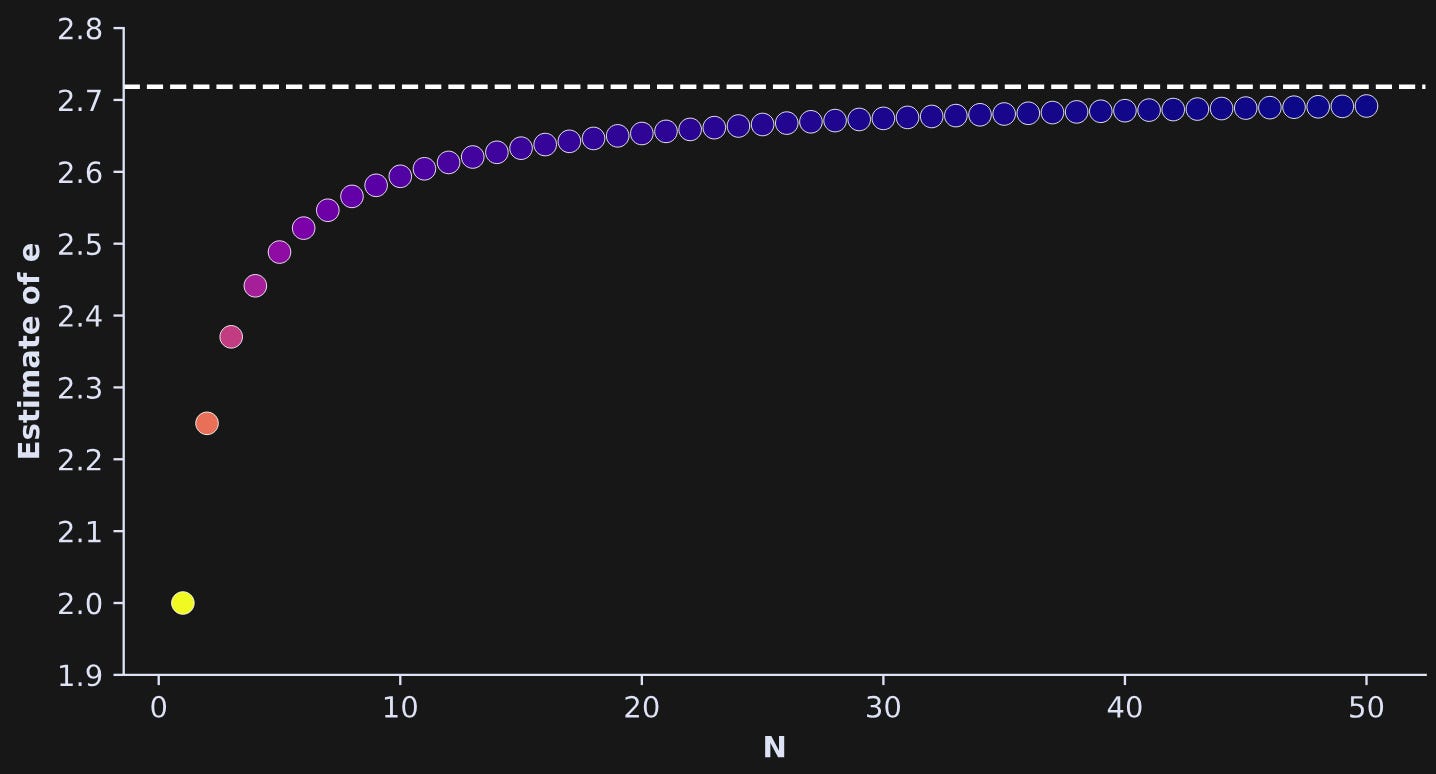
The irrational constant e has, like, a bajilion applications is nearly every area of abstract and applied mathematics. It is called the natural exponential and is often used as the base of a power, e.g., e^x = exp(x). It’s also the inverse of the natural logarithm, such that log(exp(x)) = x.
There are several equivalent definitions of e, including this one:

The “lim” statement is math notation for “the limit as n goes to infinity” and means that the n parameter gets arbitrarily large.
Your goal here is to explore approximations of e for relatively small values of n.
Translate the equation above for values of n between 1 and 50, make a scatter plot of those estimates, and draw a horizontal line corresponding to the value of e from numpy. In the plot below, the color of each dot is the min-max-scaled discrepancy between each estimate and numpy’s e, using the plasma colormap.
.
.
.
.
Scroll down for the solution…
.
.
.
.

.
.
.
.
keep scrolling!
.
.
.
.
import numpy as np
import matplotlib.pyplot as plt
import matplotlib.cm as cm

Ns = np.arange(1,51)
eestimates = (1+1/Ns)**Ns
norm_errors = np.abs(eestimates-np.e)
norm_errors = (norm_errors-norm_errors.min()) / (norm_errors.max()-norm_errors.min())

plt.figure(figsize=(8,4))
plt.scatter(Ns,eestimates,60,linewidth=.3,edgecolor='w',color=cm.plasma(norm_errors))
plt.axhline(np.exp(1),color='w',linestyle='--')
plt.gca().set(xlabel='N',ylabel='Estimate of e',ylim=[1.9,2.8])
plt.show()
Hii,
Please hereby my solution:
# DDC-40: Estimating e
import numpy as np
import matplotlib.pyplot as plt
from sklearn.preprocessing import MinMaxScaler
# --- generating the n---
n = np.linspace (1, 50)
# ---the function---
est_func = [(1+1/n)**n for n in n ]
true_e = np.e
# ---converting the list to numpy array ---
estimates =np.array(est_func, dtype = float)
# --- compute descrepancies---
discrepancies = np.abs (estimates-true_e).reshape (-1,1)
# --- Apply min-max scaling to map the discrepancies
scaler = MinMaxScaler()
colors_scaled = scaler.fit_transform (discrepancies).flatten()
# --- scatter plot---
plt.figure (figsize=(12,5))
scatter = plt.scatter (n, estimates, c = colors_scaled, cmap = "plasma", s = 100, edgecolor = "black")
plt.axhline (y = true_e, color ="orange", linestyle ="--", linewidth = 2)
plt.xlabel("n")
plt.ylabel ("estimate of e")
plt.ylim (1.95, 2.8)
plt.gca().spines ["top"].set_visible (False) # hide top border
plt.gca().spines ["right"].set_visible (False) # hide right border