
DDC-41: Monte-Carlo approximation of pi
A data challenge a day helps you master machine learning
About these daily data challenges
Each post is an exercise that helps you learn about data in Python.
Try to solve the exercise before checking my solution at the bottom of the post 🤓
You can share your solution or visualization in the comments!
Today’s challenge
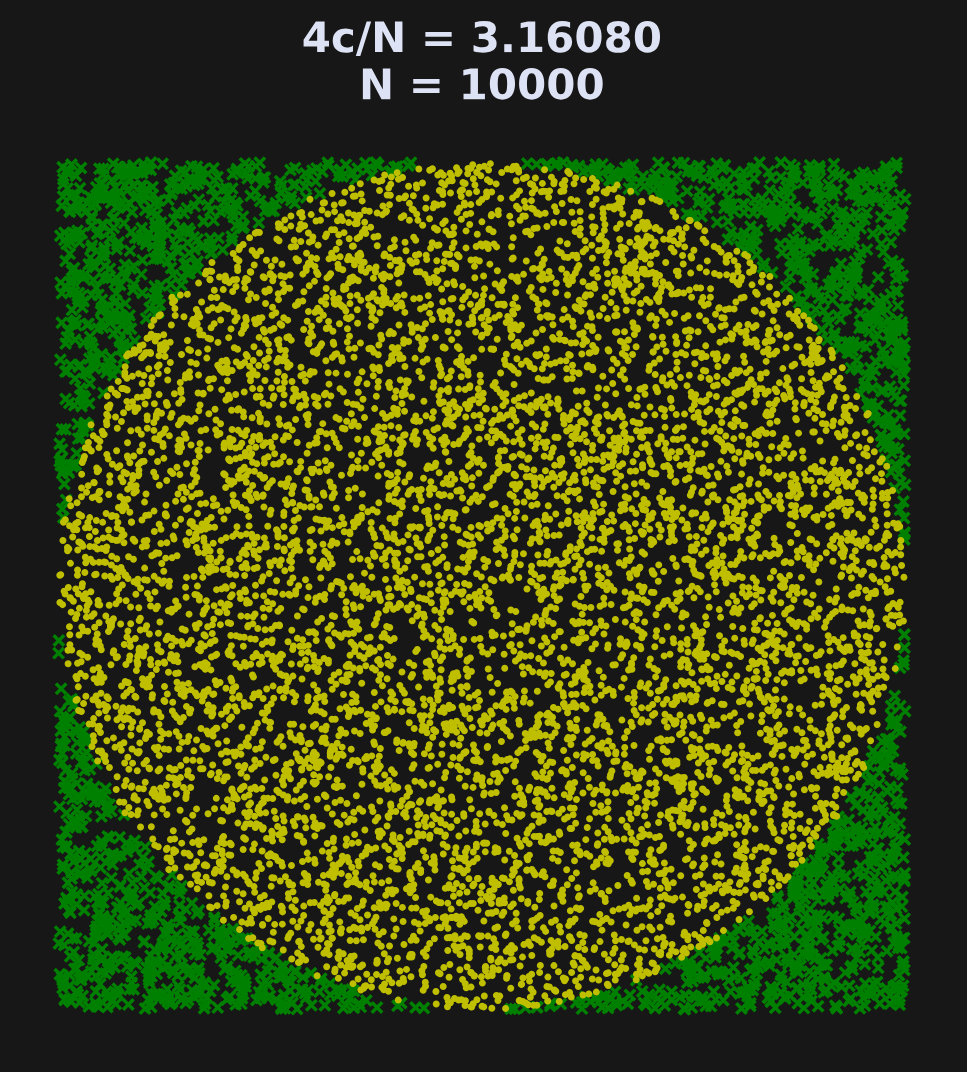
The irrational number π can be empirically approximated by randomly sampling points in a square with boundaries [-1,1,-1,1], counting the number of random points that are also in the unit circle (defined as (x^2+y^2)<1), and multiplying their ratio by 4.
Implement this approximation as shown below. Each plotted location is a random (x,y) pair drawn from a uniform distribution between -1 and +1, and the coordinate is a green “x” if it’s outside the circle, and a yellow dot if it’s inside the circle. In the figure title, c is the number of points inside the circle. As you increase N, the approximation gets closer to π.
.
.
.
.
Scroll down for the solution…
.
.
.
.

.
.
.
.
keep scrolling!
.
.
.
.
import numpy as np
import matplotlib.pyplot as plt

n = 10_000
x = np.random.uniform(-1,1,n)
y = np.random.uniform(-1,1,n)
D = x**2+y**2

plt.plot(x[D>1],y[D>1],'gx',markersize=3)
plt.plot(x[D<1],y[D<1],'y.',markersize=2)
plt.gca().set(title=f'4c/N = {4*(D<1).sum()/n:.5f}\nN = {n}',
              aspect='equal', frame_on=False,
              xticks=[],yticks=[])
plt.show()
Wow, the Brazil flag comparison made me chuckle. I was trying to visualize that uniform distributiojn during my Pilates and almost lost my balance! So smart.
Hey Mike, i have got a question though..is that what we see a Cartesian axes centered i (0,0) and bounded in [1,1-1,-1]? Should the c equation be multiple by 4? Please your clarification 🙂