
DDC-42: Softmax function, manual and PyTorch
A data challenge a day helps you master machine learning

About these daily data challenges
Each post is an exercise that helps you learn about data in Python.
Try to solve the exercise before checking my solution at the bottom of the post 🤓
You can share your solution or visualization in the comments!
Today’s challenge
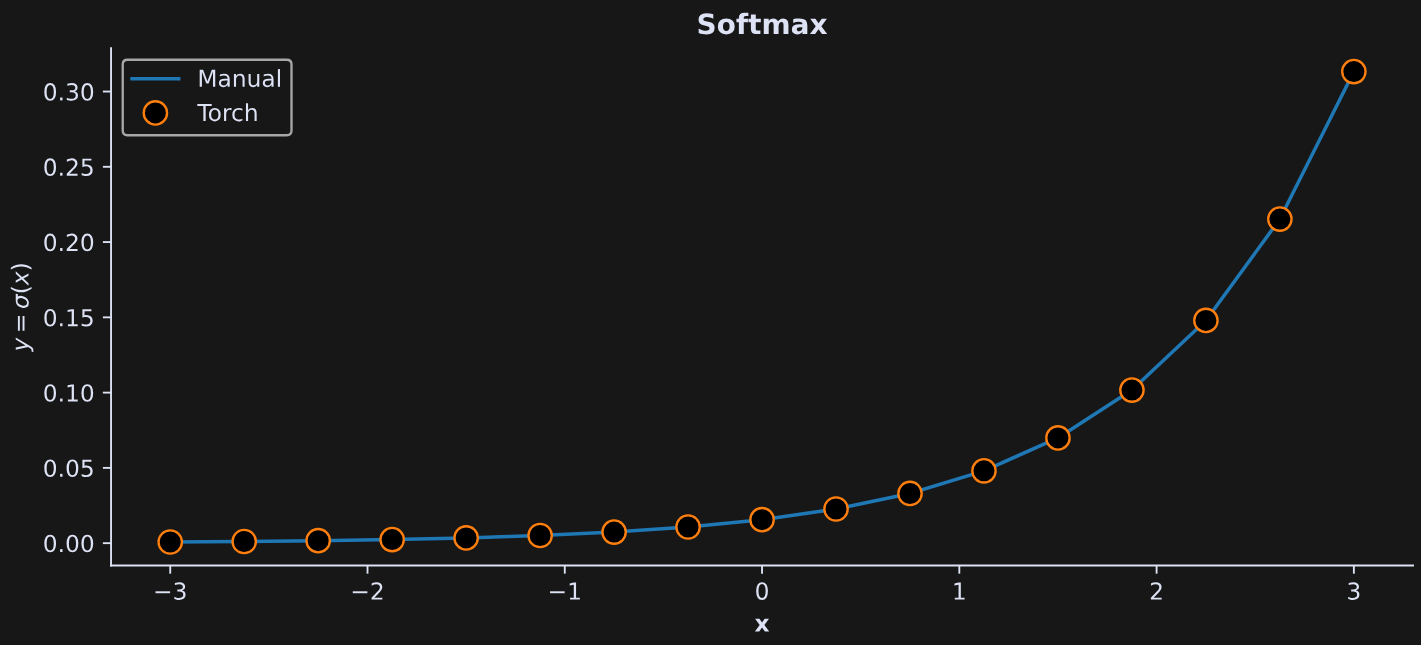
The softmax function is used in machine-learning and optimization. Among other applications, it can transform a set of numbers to a probability distribution. The equation for softmax is:

Your goal here is to implement the softmax function twice: (1) manually implementing that equation using numpy, and (2) using the torch.softmax function (the torch library is from PyTorch, and is used to construct, train, and deploy deep learning models). Be mindful of data types.
To show equivalence of the two approaches, apply both functions to 17 linearly spaced numbers between -3 and +3, and produce the figure below.
.
.
.
.
Scroll down for the solution…
.
.
.
.

.
.
.
.
keep scrolling!
.
.
.
.
import numpy as np
import torch
import matplotlib.pyplot as plt

x = np.linspace(-3,3,17)

softmax_man = np.exp(x) / sum(np.exp(x))
softmax_torch = torch.softmax(torch.tensor(x),dim=-1)

plt.figure(figsize=(10,4))
plt.plot(x,softmax_man,label='Manual')
plt.plot(x,softmax_torch,'o',markersize=10,markerfacecolor='k',label='Torch')
plt.legend()
plt.gca().set(xlabel='x',ylabel='$y = \\sigma(x)$',title='Softmax')
plt.show()
Hi, Here's my solution:
# DDC-42: Softmax function, manual and PyTorch
import numpy as np
import torch
import matplotlib.pyplot as plt
# ---generating the x ---
x = np.linspace (-3, 3, 17)
# ---calculating softmax---
softmax_func = np.exp(x)/sum (np.exp(x))
# ---using torch.softmax function---
# --- convert NumPy array to PyTorch tensor---
x_tensor = torch.tensor (x, dtype = torch.float32)
# Apply softmax
y = torch.softmax(x_tensor, dim=0)
# ---plot---
plt.figure (figsize=(10,6))
plt.plot (x, softmax_func, linestyle = "-", color = "blue", label = "manual")
plt.scatter (x,y, linewidths =2, marker = "o", label= "torch", color = "red")
plt.xlabel ("x")
plt.ylabel (r"$\sigma(x)$")
plt.title ("softmax")
plt.legend()
plt.show()