
DDC-47: Least squares in numpy
A data challenge a day helps you master machine learning

About these daily data challenges
Each post is an exercise that helps you learn about data in Python.
Try to solve the exercise before checking my solution at the bottom of the post 🤓
You can share your solution or visualization in the comments!
Today’s challenge
Implement least-squares (the linear algebra solution to fitting regression models to data) using np.linalg.lstsq.
The “design matrix” (first input to lstsq()) is a tall matrix with a column of 10 ones and a column of the numbers 0 through 9. The “data vector” (second input to lstsq()) is the numbers 0 through 9 squared.
The first output of lstsq() is a vector of two coefficients that are the intercept and slope of the best-fit line. Matrix-multiply the design matrix by the coefficients to get the least-squares best-fit line (red line in the figure below). Then produce this plot:
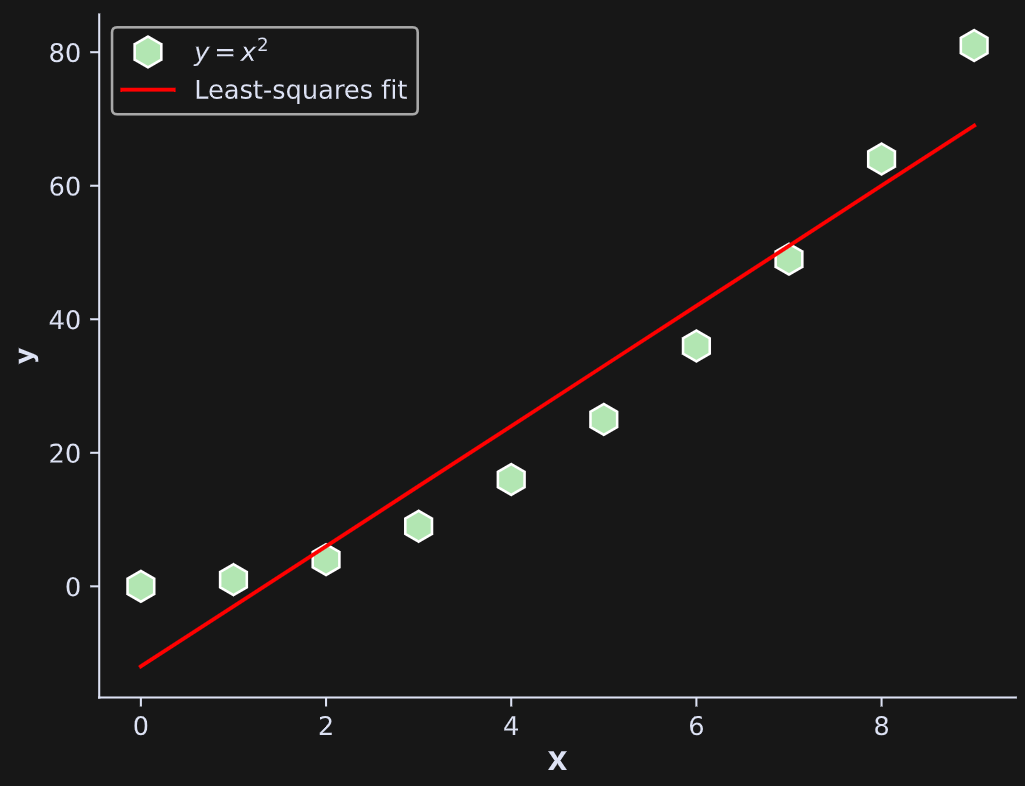
(Note: The line is a poor fit to the data because the design matrix is not optimized for the data, not because least-squares cannot fit a quadratic.)
.
.
.
.
Scroll down for the solution…
.
.
.
.

.
.
.
.
keep scrolling!
.
.
.
.
import numpy as np
import matplotlib.pyplot as plt

N = 10
X = np.vstack((np.ones(N),np.arange(N))).T
y = np.arange(N)**2
beta = np.linalg.lstsq(X,y)[0]

plt.plot(y,’wh’,markersize=12,markerfacecolor=[.7,.9,.7],label=’$y=x^2$’)
plt.plot(X@beta,’r’,label=’Least-squares fit’)
plt.legend()
plt.gca().set(xlabel=’X’,ylabel=’y’)
plt.show()