
DDC-79: Latex coding in plot legends
A data challenge a day helps you master machine learning
About these daily data challenges
Each post is an exercise that helps you learn about data in Python.
Try to solve the exercise before checking my solution at the bottom of the post 🤓
You can share your solution or visualization in the comments!
Today’s challenge
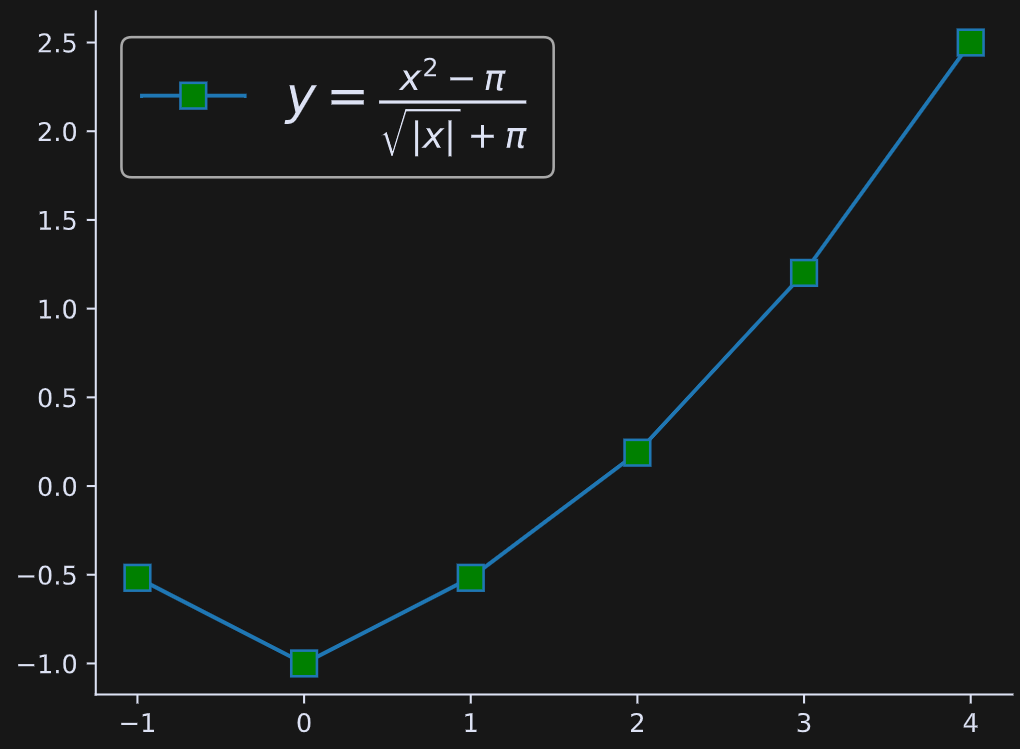
Don’t use numpy for this exercise; only matplotlib and base Python functions. You can estimate π as 22/7.
Produce the figure below, using latex coding to format the legend.
.
.
.
.
Scroll down for the solution…
.
.
.
.

.
.
.
.
keep scrolling!
.
.
.
.
import matplotlib.pyplot as plt

pi = 22/7
x = [-1,0,1,2,3,4]
y = [ (xi**2 - pi)/(abs(xi)**(1/2)+pi) for xi in x]

plt.plot(x,y,'s-',markersize=10,markerfacecolor='g',
         label=r'$y = \frac{x^2-\pi}{\sqrt{|x|}+\pi}$')
plt.legend(fontsize=20)
plt.show()